Python
데이터 타입 별 barplot 그리기
yennle
2022. 1. 27. 20:33
728x90
<Serise>
import pandas as pd

serise명.plot(kind='bar')
예시▼


<DataFrame>
import matplotlib.pyplot as plt
import matplotlib

plt.bar(dataframe명['칼럼이름'], dataframe명['컬럼이름'])
예시▼

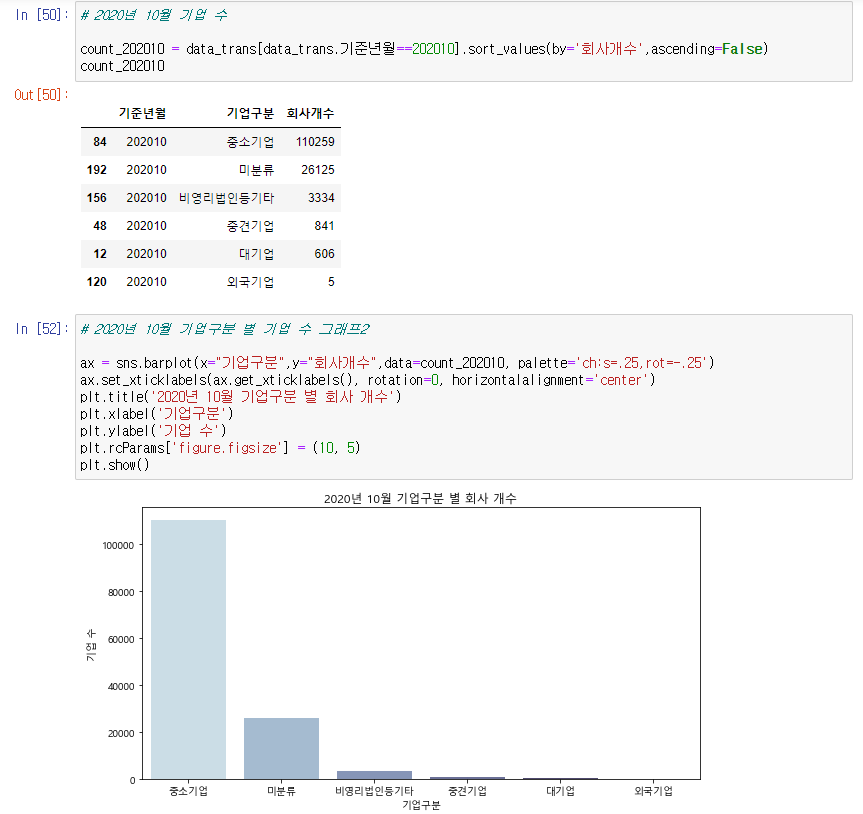
import seaborn as sns

sns.barplot(x="컬럼이름", y="컬럼이름", data=dataframe명)
예시▼
import seaborn as sns

sns.barplot(x="컬럼이름", y="컬럼이름", hue="컬럼이름", data=dataframe명)
예시▼

728x90